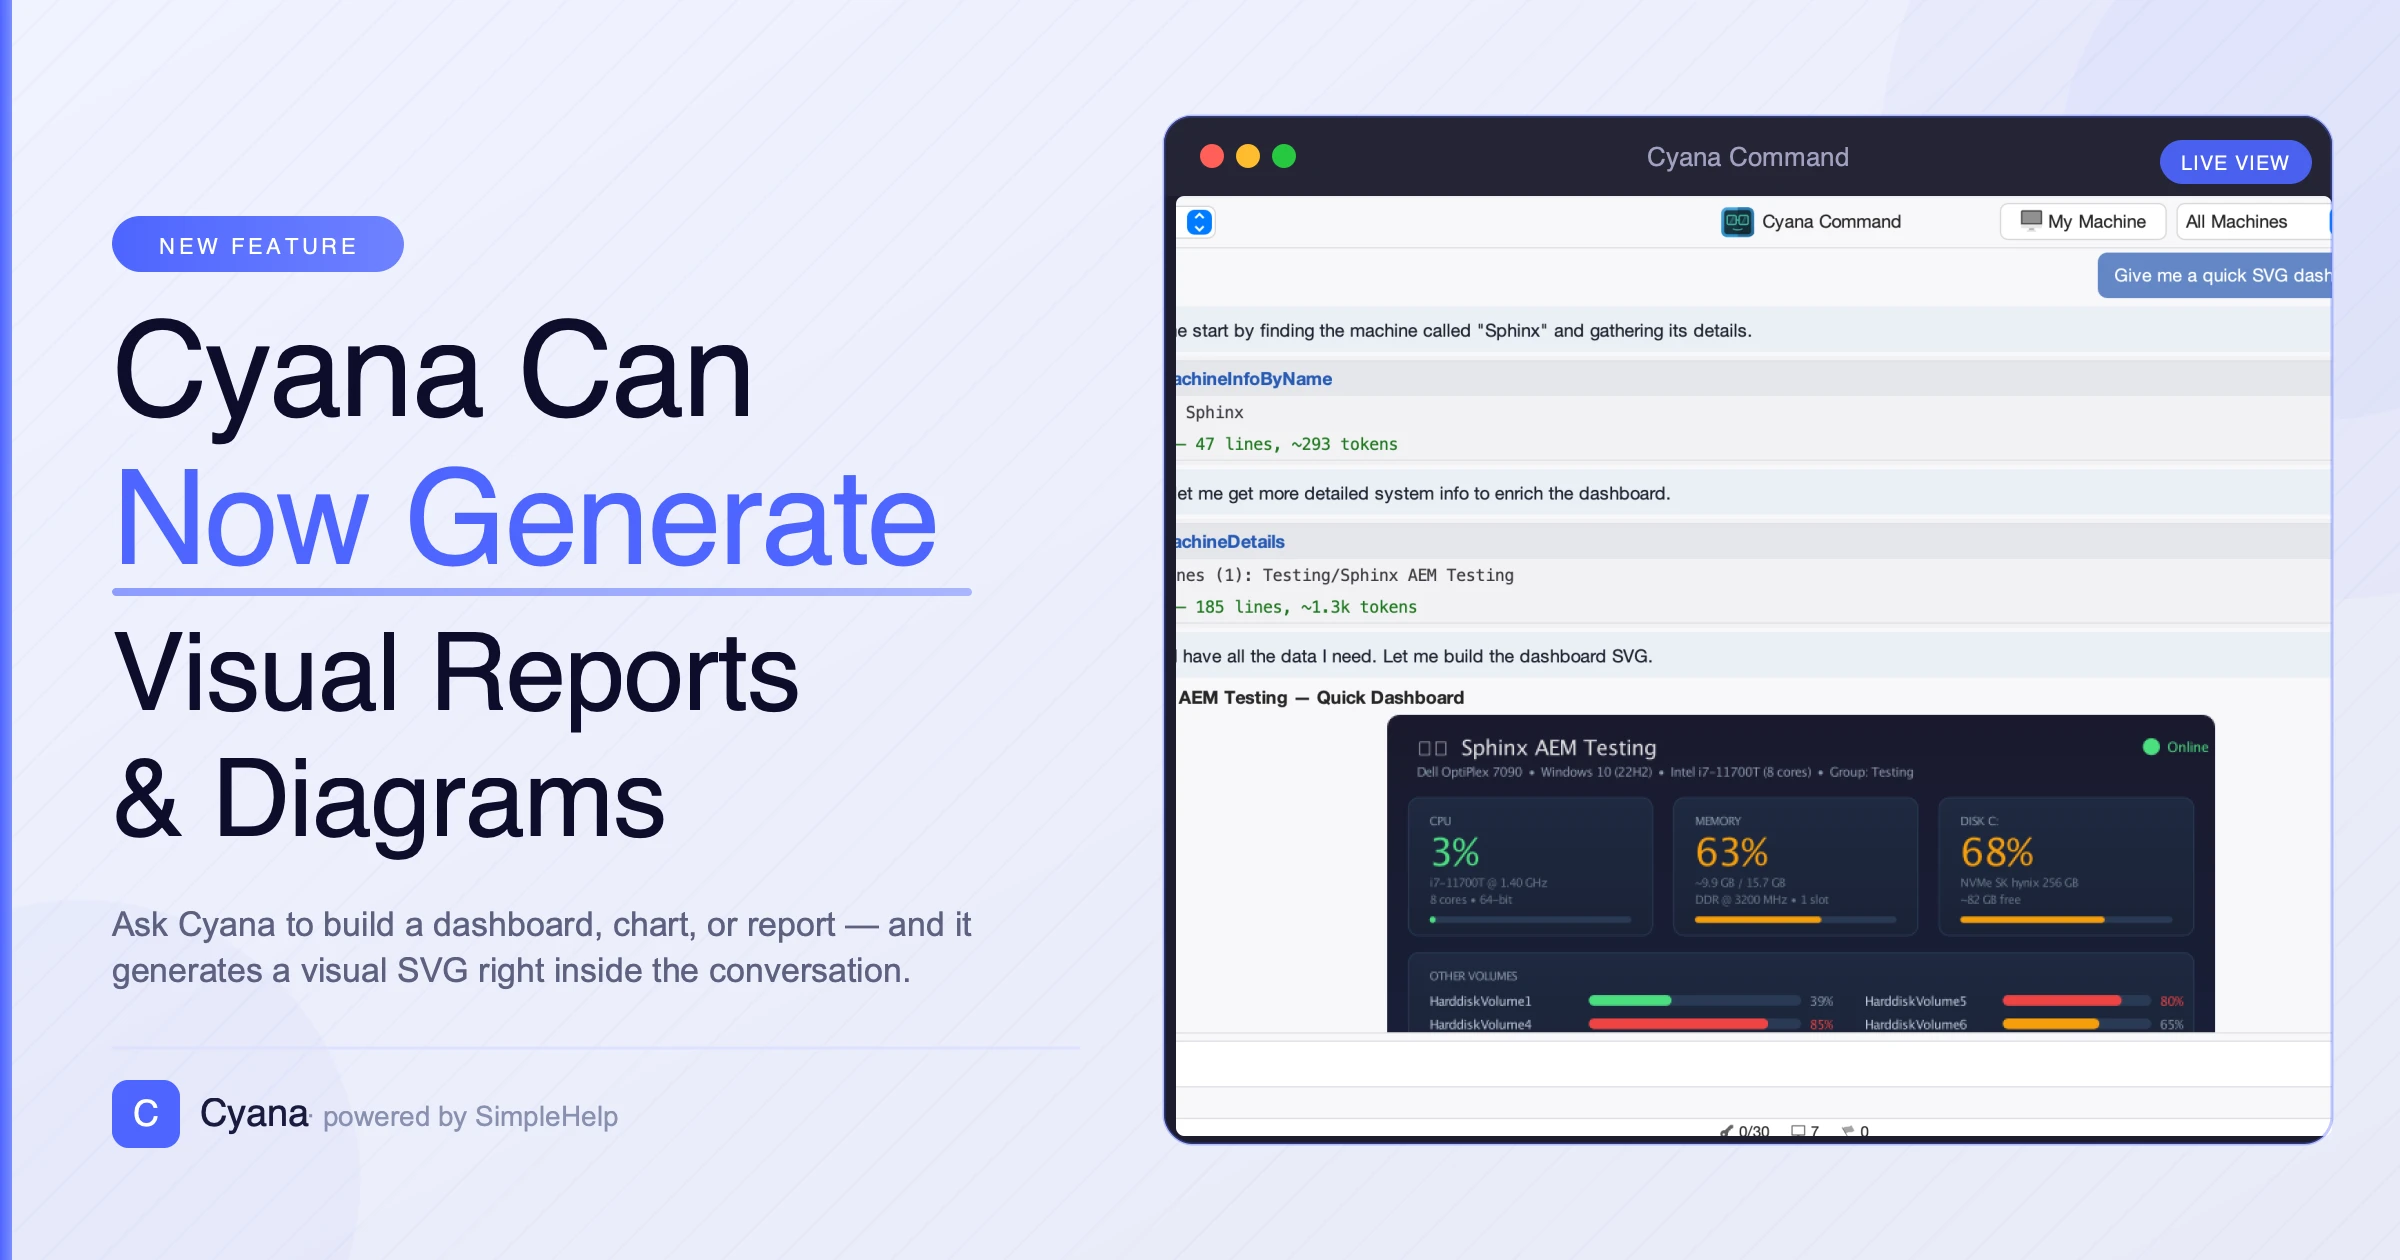
Cyana Can Now Generate Visual Reports and Diagrams
Cyana now has the ability to go beyond plain text. When you're auditing disk space across your machines, mapping out wifi speeds, or summarising software versions by department, a chart or a formatted report tells the story far more clearly than a wall of text.
Antony Miguel
With the latest update, Cyana can now generate two new types of rich output directly in the chat: SVG images and HTML reports.
SVG Charts and Diagrams
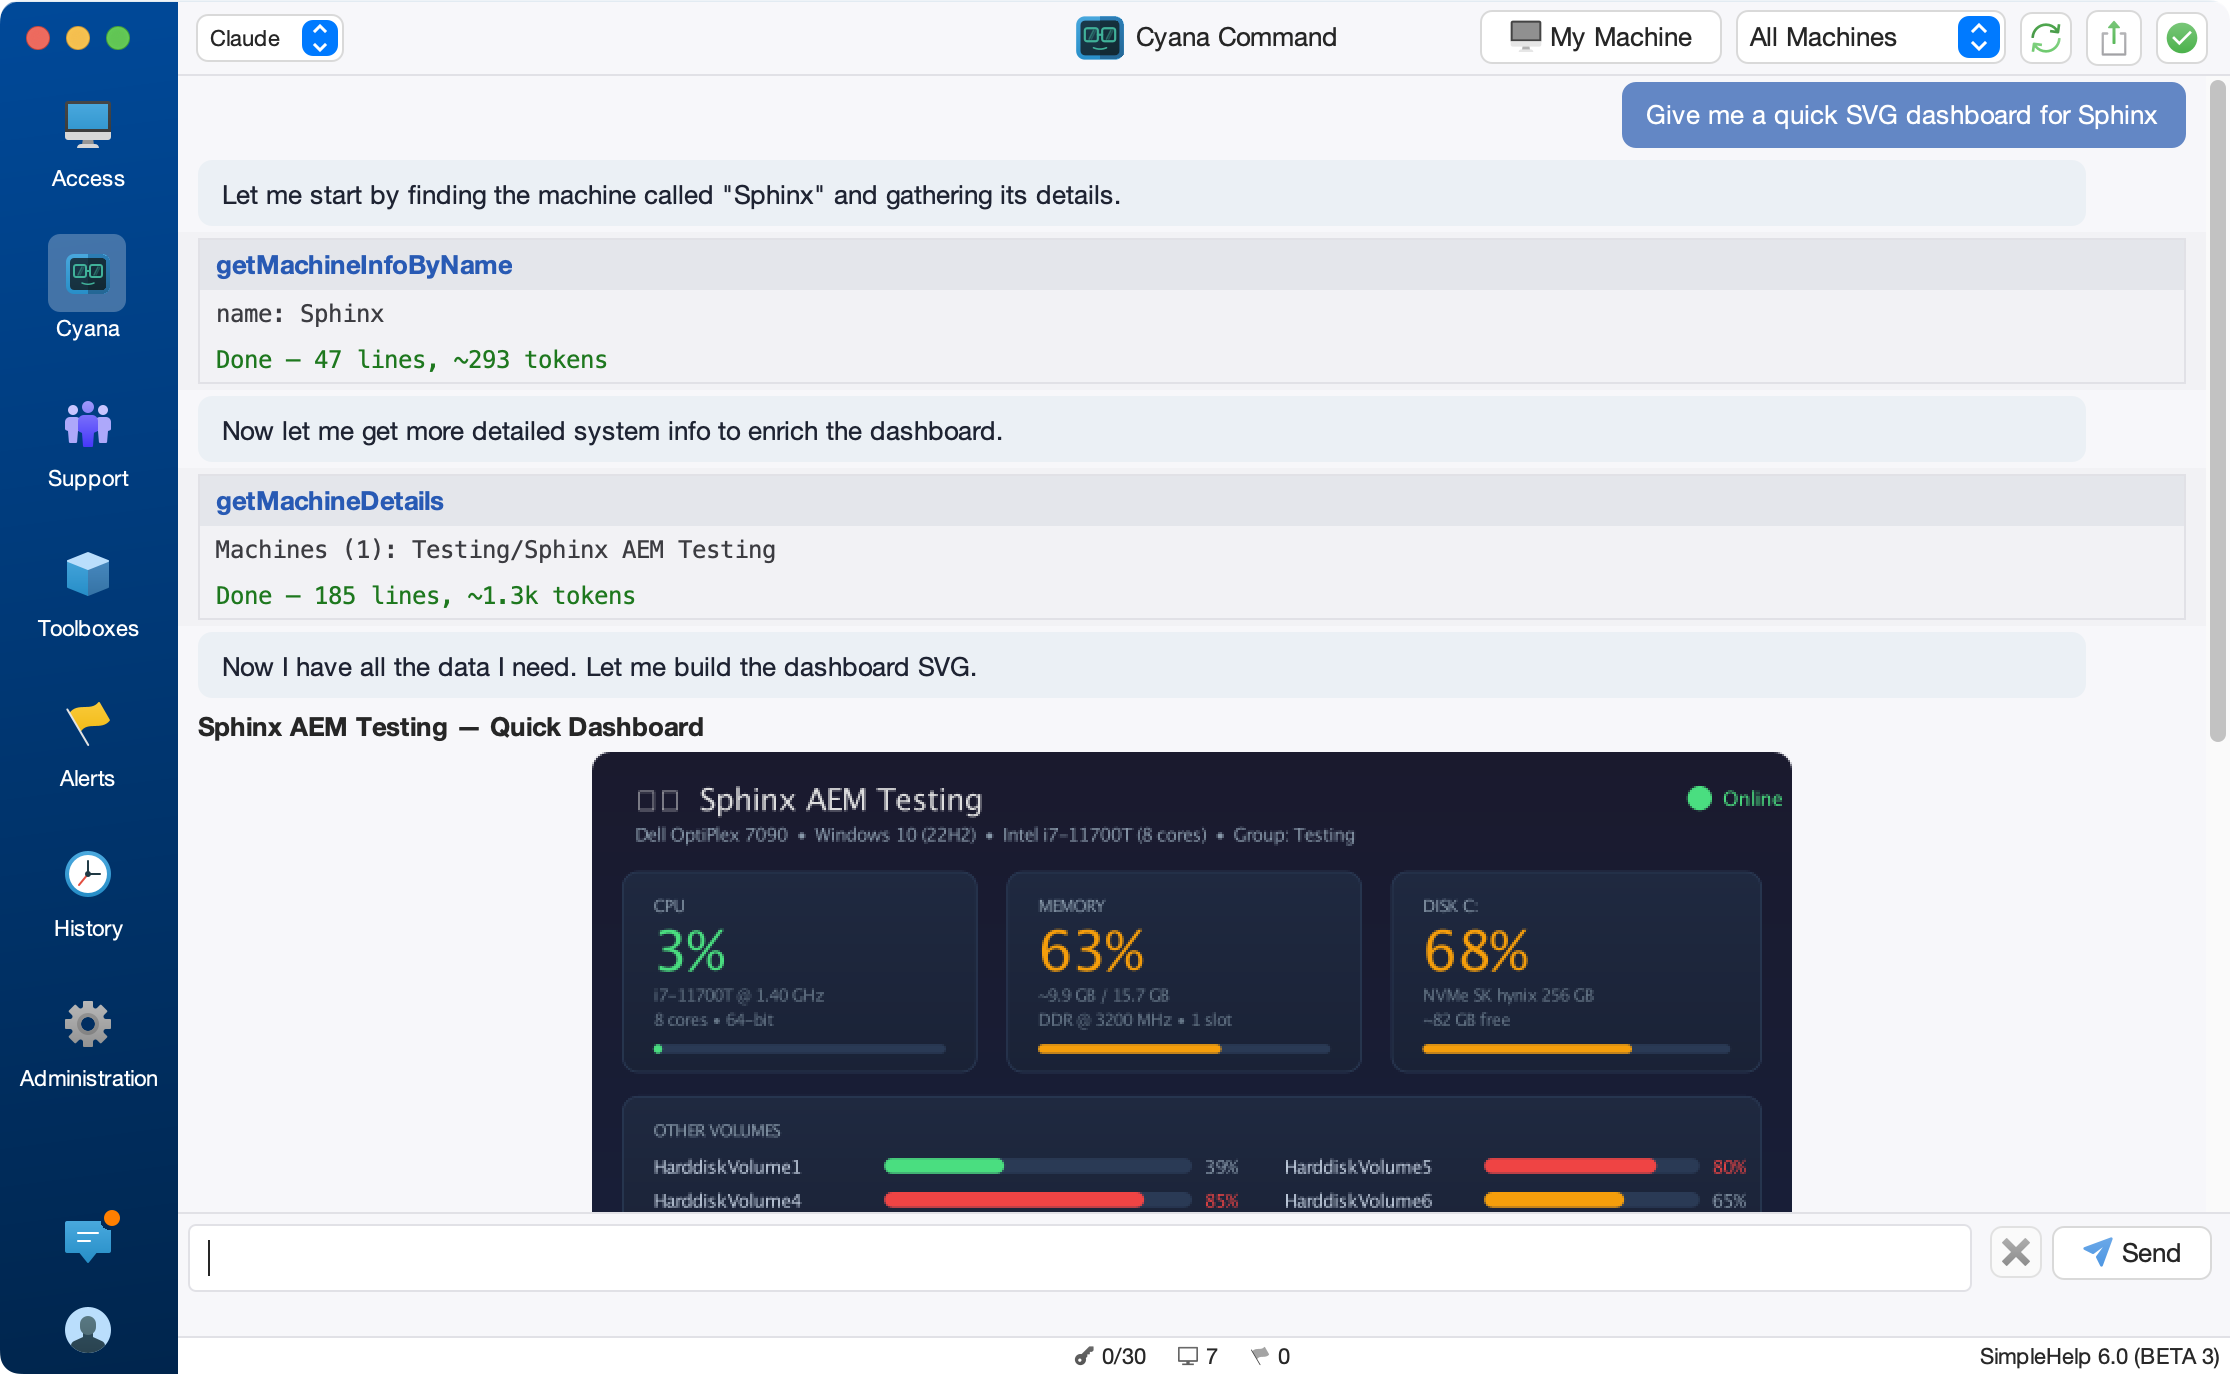
Cyana can now produce SVG images inline in the conversation. Ask it to visualise data and it will generate a chart, diagram, or map and render it right in the chat window.
Cyana generating an SVG pie chart inline in the conversation
This works well for the kinds of visual summaries that come up during everyday support and administration:
- Pie charts showing disk usage distribution across a machine group
- Bar charts comparing installed software versions
- Network topology diagrams for a site or subnet
- Status dashboards showing service health at a glance
The SVG is directly in the chat panel, so you can see the detail without leaving the conversation but you can also hit a button to view it full screen in a browser.
Export Options
Every SVG block includes three options in the bottom corner:
- View opens the SVG in your browser for full-screen interactive viewing
- PNG exports a high-resolution 4K render of the image, suitable for reports and presentations
- SVG saves the native vector file, which you can open in any design tool or embed in documentation
The high-resolution PNG export is particularly useful when you need to include a chart in a client report or an internal presentation.
HTML Reports
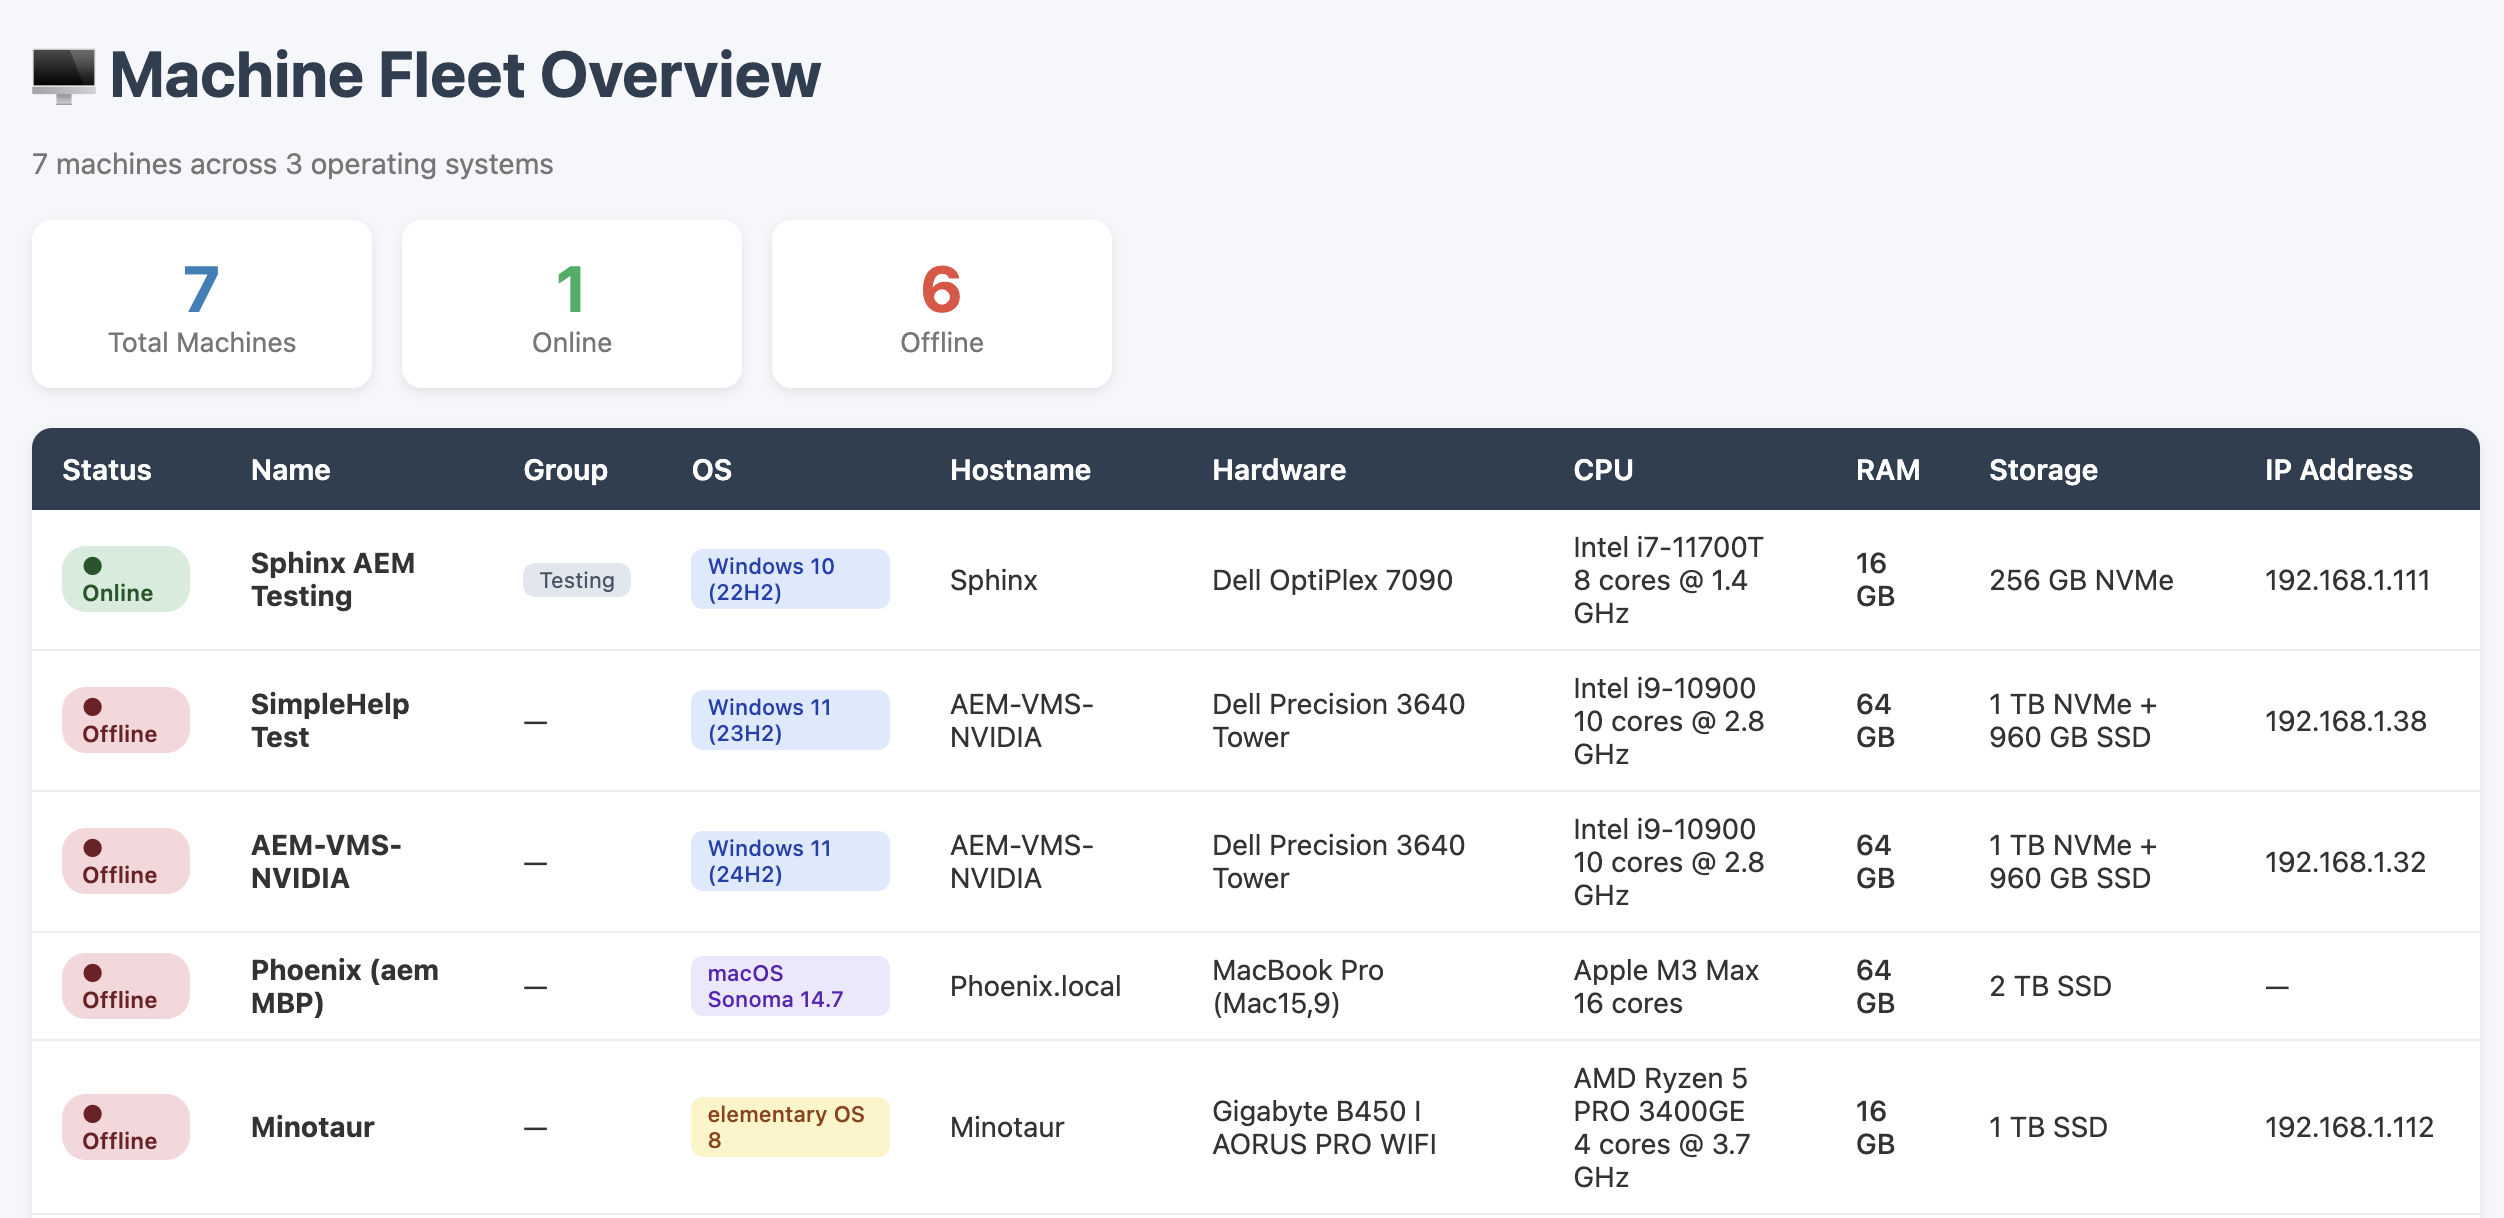
For richer, multi-section output that goes beyond a single image, Cyana can now generate full HTML reports. These are useful when the output includes styled tables, conditional formatting, colour-coded status indicators, or a combination of text, tables, and inline graphics.
An HTML report card in the Cyana chat with View and Export buttons
When Cyana generates an HTML report, it appears in the chat as a card with the report title and two buttons:
- View opens the report in your browser
- Export saves it as an HTML file you can share or archive
This is a good fit for tasks like:
- A software audit report with machines grouped by compliance status
- A detailed event log analysis with highlighted anomalies
- An inventory export with conditional formatting for outdated items
- A multi-section health check summary for a group of servers
Because the report opens in a standard browser, it renders with full CSS support and can handle much more complex layouts than the chat window itself.
How It Works
You can ask Cyana to explicitly use these tools but doing so isn't required. Just describe what you want and Cyana will choose the right output format for the job.
Both features work in Cyana Command (the main technician console) and in Cyana Session (during a remote session). No additional configuration is required. If Cyana is already set up on your server, the new output types are available immediately.
Security
SVG content is sanitized before rendering with script tags and event handler attributes automatically removed to prevent any embedded code from executing. HTML reports are opened in your browser from a temporary local file, not from a remote URL.
Both tools are display-only and do not require technician approval before they appear in the chat (though information gathering steps may require approval if they are beyond the existing automatically gathered info).
Try It Out
Update to the latest v6 beta build and try asking Cyana to visualise some of your machine data. A few prompts to get started:
- "Chart the free disk space for all machines in the Sales group as a bar chart"
- "Generate an HTML report of all installed software across the Finance group, grouped by application"
- "Show me a diagram of which machines are online vs offline in each group"
We would love to hear how you use these new features. If you have feedback or suggestions, get in touch at [email protected]